Thesis
Please check below for more info on our current research
Our research group
We are a young and dynamic research group at the department of Physics and Astronomy led by Prof. Vandersickel (nele.vandersickel@ugent.be). We perform research at the edge of science including physics, computer programming and medicine, a truly interdisciplinary setting. Our research focuses on the analysis of cardiac arrhythmia, which is the main cause of death in the Western society. We provide weekly guidance, step by step, while we will also invite you to come up with own ideas and allow room for creativity. We will give you insight in the scientific process of solving problems, while also focusing on personal growth. We aim for the thesis to allow you to do interesting research while also enjoying the process. Ask a former master student how they experienced their master thesis with us.
What are we looking for? We do not care about your previous scores, but we ask a motivated mindset and a love for programming and solving problems.
What will you do? We do not make subjects just to keep you busy, but you will actually contribute to our scientific research. We have selected subjects which are possible to investigate during one year, while also being able to actually make a contribution. If you succeed, your research should be able (maybe joined with other research) to be published in a scientific journal. How cool would that be?
2025-26 thesis subjects
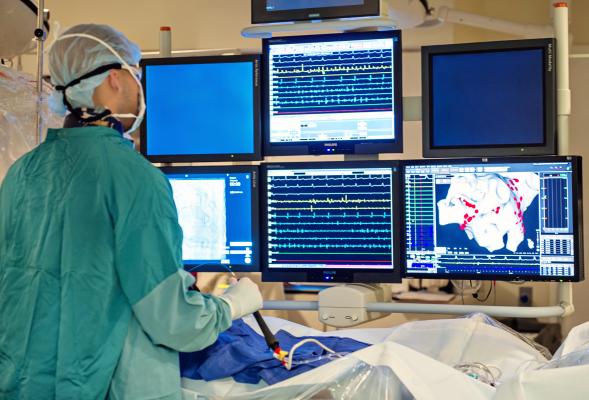
We present some subjects which seem relevant to us. If you have a specific interest, please also talk to us, and we might be able think of other subjects which match your interests. We can also bring you to the clinic so you can observe ablation procedures and explain and discuss your results with the medical doctors.
Cardiac Christmas Trees – Exploring Wave Breakup Around Scars in 3D Heart Models
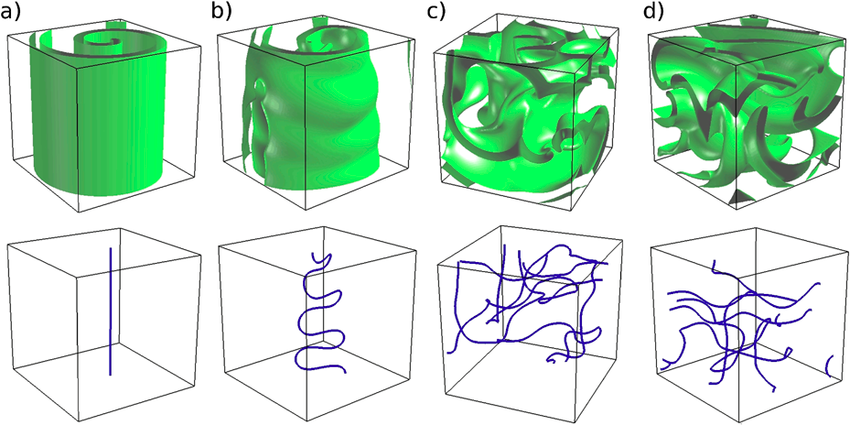
Summary · In certain heart rhythm disorders (arrhythmias), electrical activity in the heart becomes chaotic due to rotors—spiraling waves of excitation that can self-sustain and disrupt normal contraction. In 3D cardiac tissue, these rotors can extend into structures called scroll waves, which anchor, twist, and evolve through the thickness of the heart wall. These scroll waves can be surprisingly stable—or break up into complex patterns that make arrhythmias harder to treat. One key factor influencing this behavior is scar tissue in the heart, often formed after heart attacks or due to disease. But how exactly does the shape of a scar affect wave dynamics?
Mission · This project aims to explore how asymmetrically shaped scars in cardiac tissue affect the stability and breakup of scroll waves. Using state-of-the-art computational simulations, you will model scroll waves in 3D cardiac tissue and introduce scars of various shapes and sizes that you will systematically vary in size. Using our software you will investigate whether wave breakup occurs and multiple wavefronts emerge, forming "garlands" around the scar—earning the name Cardiac Christmas Trees. You will then relate the observed wave behavior to fundamental tissue properties such as Action Potential Duration (APD) –how long a cell stays excited– Conduction Velocity (CV) –how fast the wave travels through tissue–.
Why this matters · Understanding how scar geometry influences scroll wave stability could help explain why some arrhythmias are more dangerous or more resistant to treatment than others. It may also lead to improved planning of ablation therapy, where targeted destruction of tissue is used to interrupt these arrhythmias.
Build the Future of Cardiac Arrhythmia Detection: Develop an Automated Testing Framework for Cutting-Edge Software to Treat Cardiac Arrhythmia
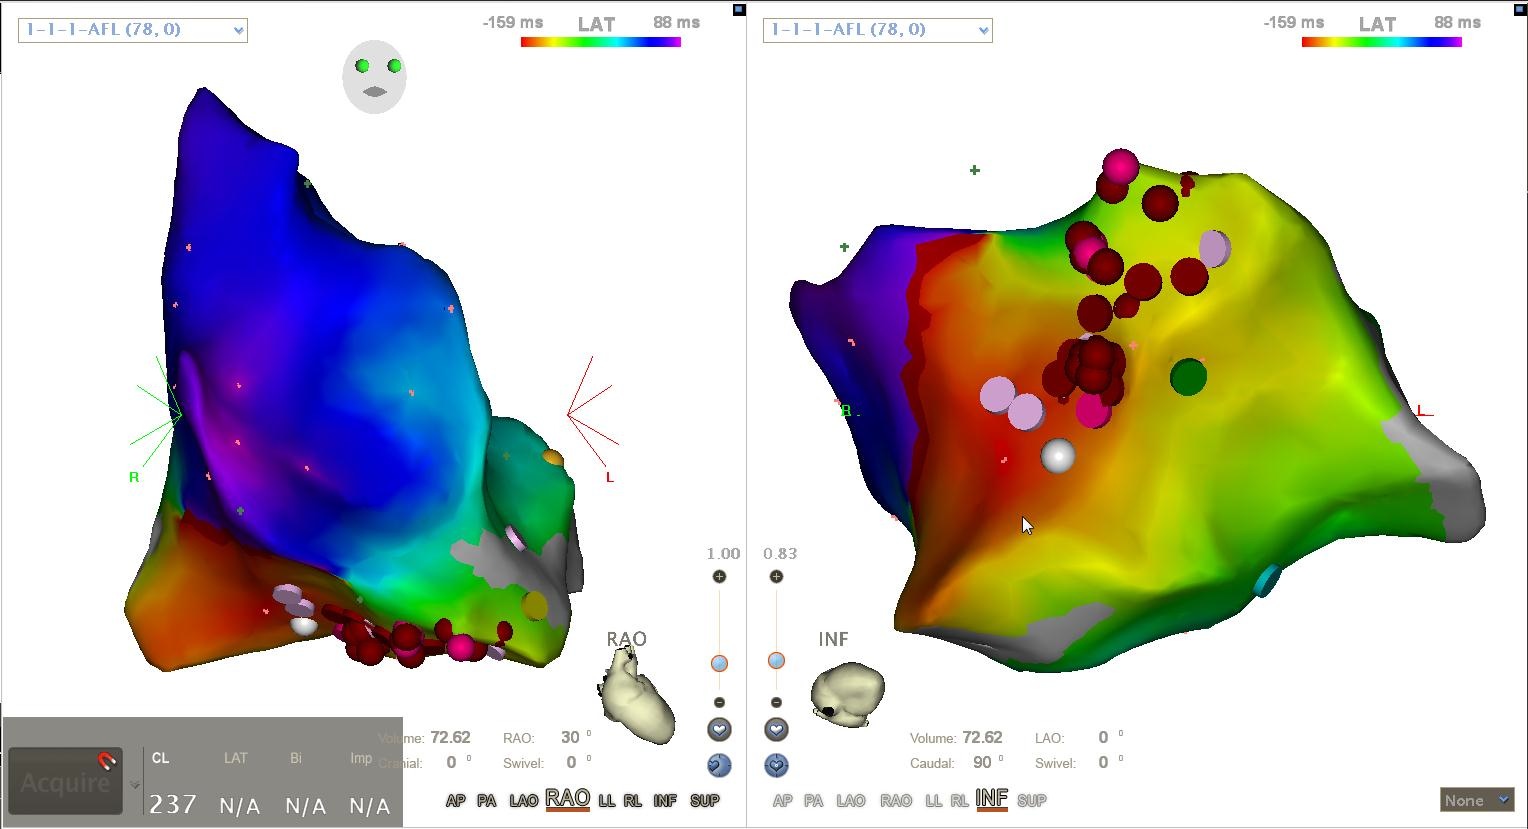
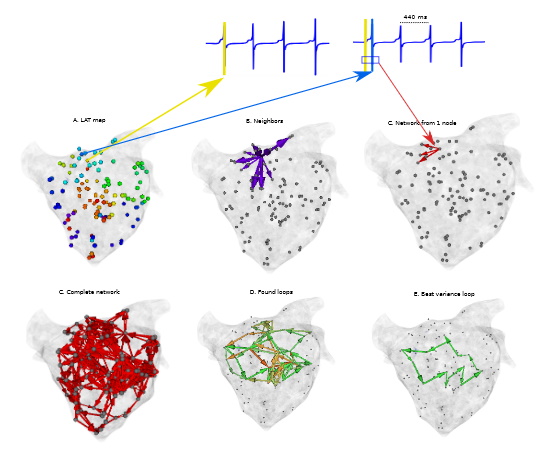
Background · The Directed Graph Mapping (DGM) software is an innovative tool developed to detect and analyze cardiac arrhythmias using network theory. As our software evolves, it is crucial to ensure that new versions consistently produce accurate and reliable results when applied to clinical data. To achieve this, we aim to develop a comprehensive testing framework that will automatically validate software updates against our entire database of clinical cases.
The DGM library contains various algorithms that can be used for different cardiac arrhythmia. These algorithms include searching for rotational activity in the heart (re-entry), searching for electrical sinks and sources (focal activity), creating a helmholtz decomposition of the graph or transforming the data into a vectorfield. Another crucial component of directed graph mapping is, as the name implies, the creating of a directed graph. As such we would also like to validate its creation. Thus, with this thesis, you will learn about various types of cardiac arrhythmia (AT, VT, AF ...) and get the opportunity to contribute something that will be used far into the future.
The images below show some of the results that a testing framework can verify. These images show respectively:
- Rotational activity detected by the cycle search algorithm.
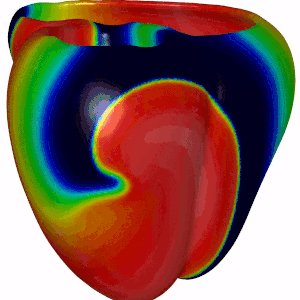
- Focal search on a 2D plane showing sources in green and sinks in purple.
- A graph created by DGM for a simulated spherical heart with AT.
- A vectorfield created by DGM.
Summary · An initial testing framework already exists, allowing comparisons between different versions of the software by running algorithms and analyzing the results. However, this framework currently includes only a single test. The goal of this thesis is to significantly expand and improve this testing system by developing additional automated test pipelines that target the main components of the codebase and core outcomes.
Your initial goal will be to develop automated pipelines to test core functionalities and key results of the software on the entire clinical database. This also includes creating a test report that gives a concise overview of the results.
Depending on the intrests of the thesis student, the framework can be expanded to include one or more of the following features:
- Intermediate Results Validation: Integrate intermediate tests within the pipelines to capture and compare intermediate outputs at fixed points during execution.
- Enhanced Testing Coverage: Expand the range of algorithms and components being tested to cover a broader spectrum of the codebase.
- Visualization and Reporting: Create clear, user-friendly visualizations and test reports to summarize results and highlight discrepancies.
- Statistical Analysis: Calculate relevant statistics and performance metrics to assess the consistency and accuracy of the results.
- Reproducibility and Stability Verification: Incorporate our previous research papers and analysis pipelines to ensure that past results remain consistent across newer software versions. This will enhance reproducibility, especially when new cases are added to the database. This task is particularly valuable for gaining experience with diverse concepts related to cardiac arrhythmias.
- Algorithm Comparison: Implement the ability to test different algorithms against each other on the same database to evaluate their relative performance and consistency.
- Model Validation and Cross-Validation: Implement statistical validation methods (e.g., cross-validation) to assess the robustness of algorithms when comparing outputs across versions.
- Version Tracking and Reporting: Maintain a detailed log of each test run, including software version, algorithms used, and outcomes, to ensure full traceability and reproducibility
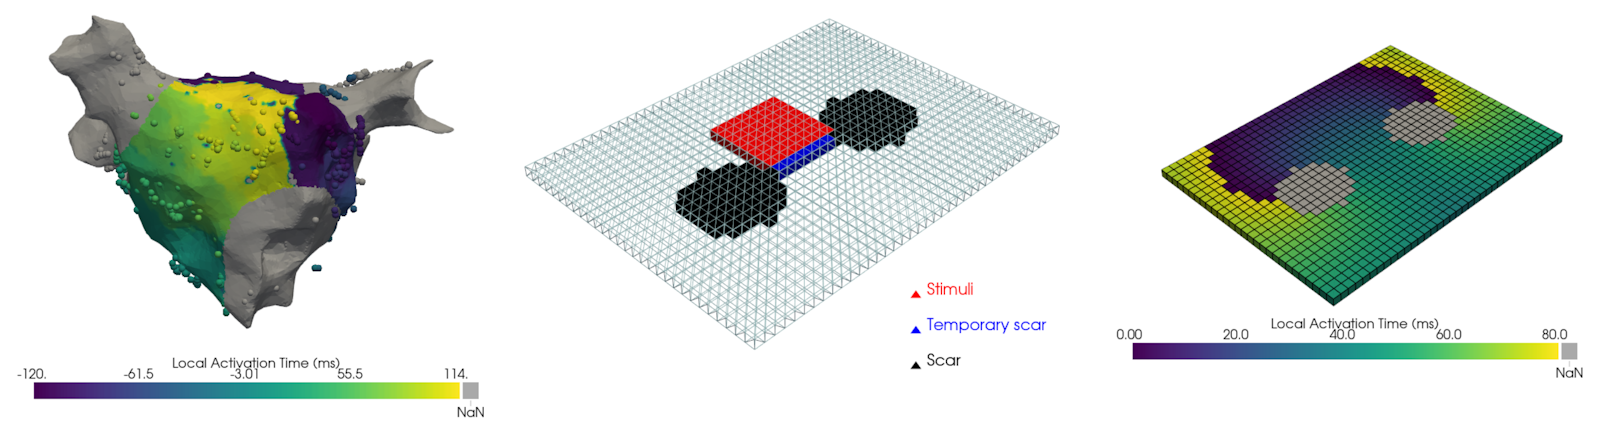
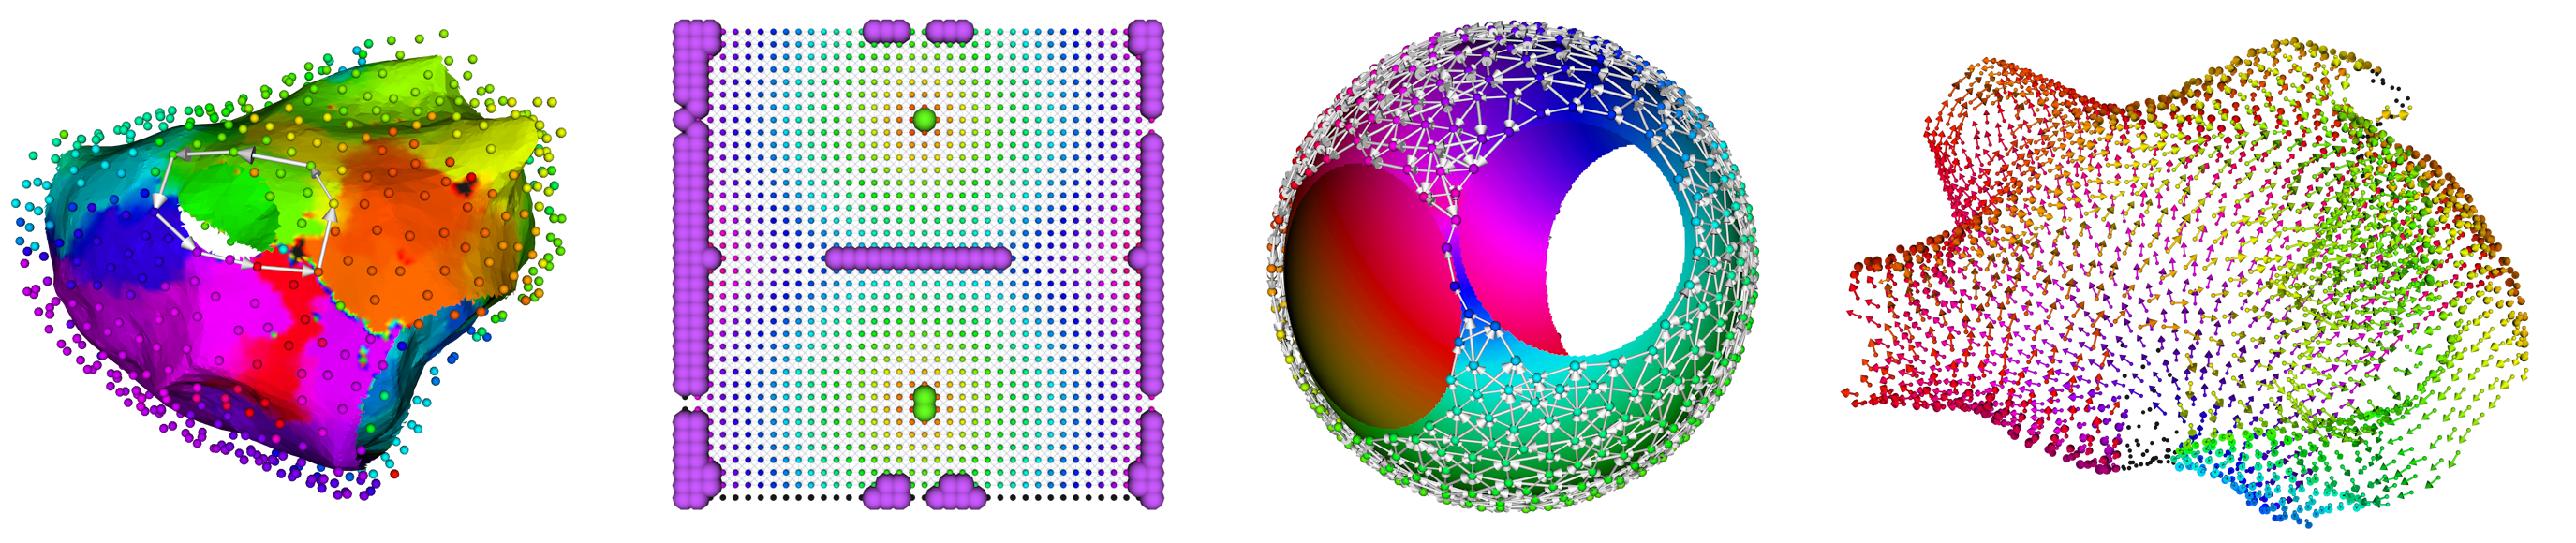
Enhancing the Transition from Simulated to Clinical Data in Atrial Tachycardia Diagnosis
Summary · Currently, many methods we develop to diagnose atrial tachycardia show promising results for simulated data, but fail to do so on clinical data. We believe the main issue is the absence of lines of functional or scar-related conduction block in our simulations. These areas lead to incorrect estimation of the physiological wavefront propagation, causing our algorithms to produce erroneous detections. Conduction block is defined as a region where excitation waves cannot travel through. It can be functional in nature, meaning the refractory period of some wave is responsible for the block of another wave. The other type is scar-related, where the conduction block is related to scarring of the cardiac tissue.
Mission · To simulate this, you will use the Finitewave Python package, a very user-friendly tool developed by our team for simple excitation wave simulations. You will start as simple as possible, using the principles of topology to deform the atrial surface into its simplest form: a square sheet with 2 holes. These simulations can then serve as a benchmark for our current AT detection algorithms and allow us to improve them by implementing additional filtering steps to model natural wavefront propagation accurately. We strongly believe this project is highly relevant, as it is the final obstacle that stops us from automatically diagnosing re-entry-based atrial tachycardia.