Thesis
You can find an introduction to cardiac arrhythmia below. More detail about our ongoing research can be found on our research page.
Our research group
We are a young and dynamic research group at the department of Physics and Astronomy led by Prof. Vandersickel (nele.vandersickel@ugent.be). We perform research at the edge of science including physics, computer programming and medicine, a truly interdisciplinary setting. Our research focuses on the analysis of cardiac arrhythmia, which is the main cause of death in the Western society. We provide weekly guidance, step by step, while we will also invite you to come up with own ideas and allow room for creativity. We will give you insight in the scientific process of solving problems, while also focusing on personal growth. We aim for the thesis to allow you to do interesting research while also enjoying the process. Ask a former master student how they experienced their master thesis with us.

What are we looking for? We do not care about your previous scores, but we ask a motivated mindset and a love for programming and solving problems.
What will you do? We do not make subjects just to keep you busy, but you will actually contribute to our scientific research. We have selected subjects which are possible to investigate during one year, while also being able to actually make a contribution. If you succeed, your research should be able (maybe joined with other research) to be published in a scientific journal. How cool would that be?
2026-2027 thesis subjects
We present some subjects which seem relevant to us. If you have a specific interest, please also talk to us, and we might be able think of other subjects which match your interests. We can also bring you to the clinic so you can observe ablation procedures and explain and discuss your results with the medical doctors.
Epicardial bridges - finding hidden electical pathways in clinical cardiac activation maps
Background · Cardiac arrhythmias remain one of the leading causes of death in Western society. Despite their clinical importance, the underlying mechanisms and their detection are still not fully understood. One such arrhythmia is atrial tachycardia (AT), a condition in which the heart beats faster than normal due to abnormal electrical activity in the atria.
A common mechanism underlying AT is re-entry, where electrical activation propagates in a self-sustaining loop, repeatedly reactivating the surrounding tissue. These re-entry circuits can be localized by mapping the heart using a catheter. During such procedures, electrical signals are recorded throughout the atrium and converted into local activation times (LATs), which indicate when specific regions of the tissue are activated.
Our group has recently developed novel methods to automatically detect these re-entry circuits from electroanatomical maps, significantly simplifying their identification. However, in some cases, the electrical activity propagates through pathways outside the atrial wall. These so-called epicardial pathways include structures such as the Vein of Marshall, the Coronary sinus, or interatrial connections like the Bachmann bundle. These structures can act as additional conduction pathways and sustain re-entry circuits. A major challenge is that these epicardial pathways are difficult or sometimes impossible to map directly. As a result, their contribution to the arrhythmia must be inferred indirectly from endocardial measurements, leaving gaps in the observed activation patterns.
In this thesis, we aim to develop methods to detect whether a patient’s AT is sustained by epicardial pathways and to localize their entry and exit sites using endocardial electroanatomical maps.
Goal · In the first stage, a method will be developed to determine whether a clinical activation map likely contains an epicardial bridge. Two complementary approaches will be pursued. First, physically motivated features will be extracted from the map, such as gaps in the LAT sequence or spatially disconnected activation regions. These features can be combined into a probabilistic classifier. Second, unsupervised machine learning will be used to compare maps with and without epicardial bridges, identifying which features discriminate between the two cases. This can be done through clustering, principal component analysis (PCA) and uniform manifold approximation and projection (UMAP).
In the second stage, the entry and exit sites of the epicardial bridge will be located. The exit sit, where activation re-enters the endocardium, manifests as a focal source of electrical activity. It can be detected by identifying regions of positive divergence in the activation velocity field or by using persistent homology and looking for high-persistence H₀ generators for the map. The entry site, where activation leaves the endocardium to travel through the epicardial pathway, is considerably harder to detect, as it often leaves no clear signature in the activation map. To find likely origin site, one can use activation gaps and find which entry sites correspond best with the detected LAT gap and the detected exit site.
Why this matters · This addresses a clinically relevant and growing problem. Epicardial pathways are increasingly implicated in atrial tachycardia, yet reliable tools for their detection and localization remain lacking. The methods developed here have direct potential to improve ablation planning for this challenging patient group. The developed methods have the potential to directly improve ablation planning for this challenging patient group. The project involves working with clinical data in collaboration with electrophysiologists, with the opportunity to go to the clinic to discuss your research and see how ablation procedures are performed.
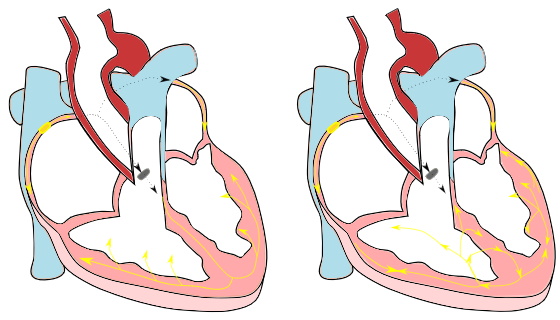
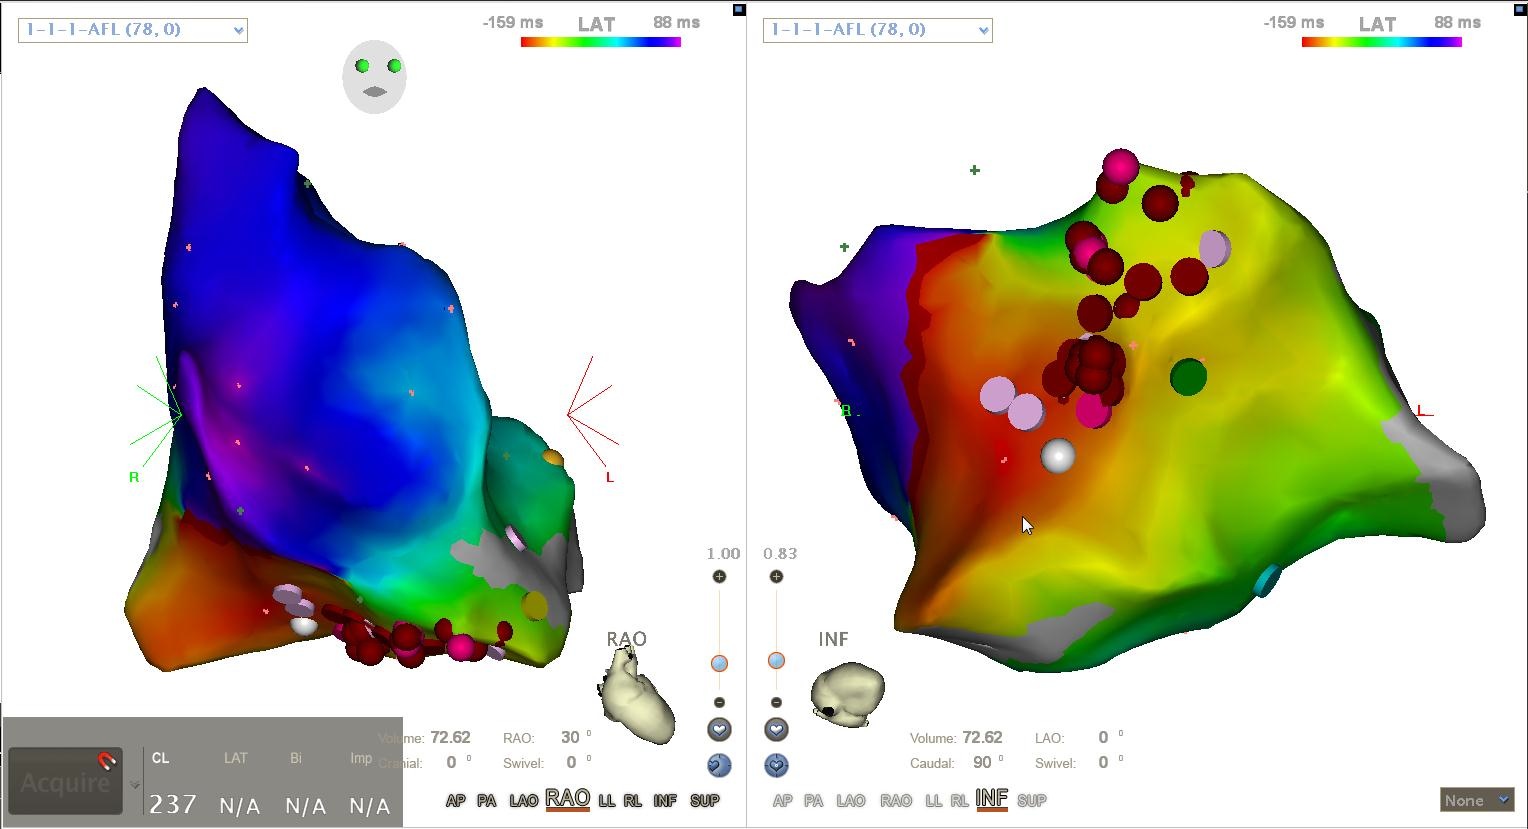
 A clinical case of left atrial tachycardia sustained by re-entry through an epicardial pathway. The entry and exit sites are shown.
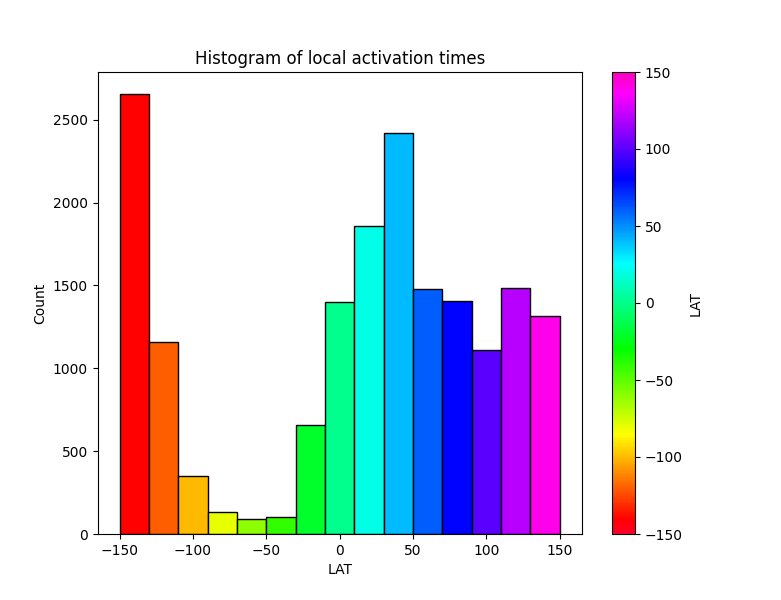 An LAT histogram showing missing LATs which hints at conduction through a hidden pathway.
Exploring phase transitions in cardiac arrhythmia using the classical XY lattice model
Background · The electrical activity of the heart manifests in several distinct configurations: sinus rhythm, tachycardia, and fibrillation. During sinus rhythm, the heart beats in a regular, coordinated fashion. When normal electrical conduction is disrupted, a cardiac arrhythmia arises, taking the form of either tachycardia or fibrillation. Tachycardia is characterized by a regular but abnormally fast heart rhythm, whereas fibrillation exhibits both irregular and accelerated electrical activity. Understanding the transition between these states is still poorly understood in cardiac electrophysiology.
A recent paper highlighted the potential of modeling this transition using the Kosterlitz-Thouless phase transition in the XY-model [1]. The XY-model is a generalization of the classical 2D Ising model, which allows all spin orientations in [0, 2π[. The KT phase transition is a phase transition based on topology, where vortex pairs are created when the temperature exceeds a critical threshold [2]. This KT transition was compared to the transition between sinus rhythm or tachycardia and fibrillation. Many similarities were found, such as power-law behavior of spatial correlation functions and vortex lifetimes. The major difficulty in applying the XY-model to a practical cardiology context lies in the fact that the XY-model describes a system in thermal equilibrium, whereas cardiac tissue is a non-equilibrium system.
Goal · This thesis aims to further investigate the analogy between the KT transition in the XY-model and the transition between cardiac states, based on realistic arrhythmia simulations. This will be done by analyzing snapshots of simulated sinus rhythm, tachycardia, and fibrillation on a simple 2D square tissue in Finitewave. Finitewave is an open-source Python package designed for simulations of cardiac arrhythmia developed by our group. In the first part of the project, the student will collect snapshots of these simulations and interpret them as equilibrium configurations of the XY-model. A methodology will then be developed to extract an effective temperature that is consistent with the given XY-model configuration (for an example, see [3]). The aim is to show that sinus rhythm or tachycardic states correspond to lower effective temperatures than fibrillation, where the effective temperature serves as a quantitative measure of order versus disorder. In the second part of the project, multiple consecutive time frames can be analyzed to determine how the temperature evolves over time and to investigate whether changes in this parameter can capture or anticipate the transition between atrial tachycardia and atrial fibrillation. In the XY-model, ordered and disordered regimes are separated by a critical temperature associated with the Kosterlitz–Thouless transition, suggesting the possibility of having a similar critical threshold in cardiac arrhythmia.
Why this matters · This interdisciplinary project brings together expertise from the biophysics group and the statistical physics group to bridge cardiac electrophysiology and statistical physics. We believe this project is highly relevant due to its fundamental nature. Research in cardiology is often top-down and inspired by digital twins, which are hyperrealistic models of human hearts. In contrast, the approach of our group is bottom-up; we start from simple simulations to investigate the drivers of cardiac arrhythmia. Our group has already been successful by applying the conservation of topological charge to ablation therapy in clinical atrial tachycardia [4]. We are currently applying these ideas to ventricular tachycardia and atrial fibrillation. This thesis perfectly fits the spirit of our group, as we aim to investigate the fundamental drivers of arrhythmic state transitions in the heart. Our end goal with this project would be to provide electrophysiologists with the ability to assess the fibrillation inducibility during surgery based on a critical threshold.
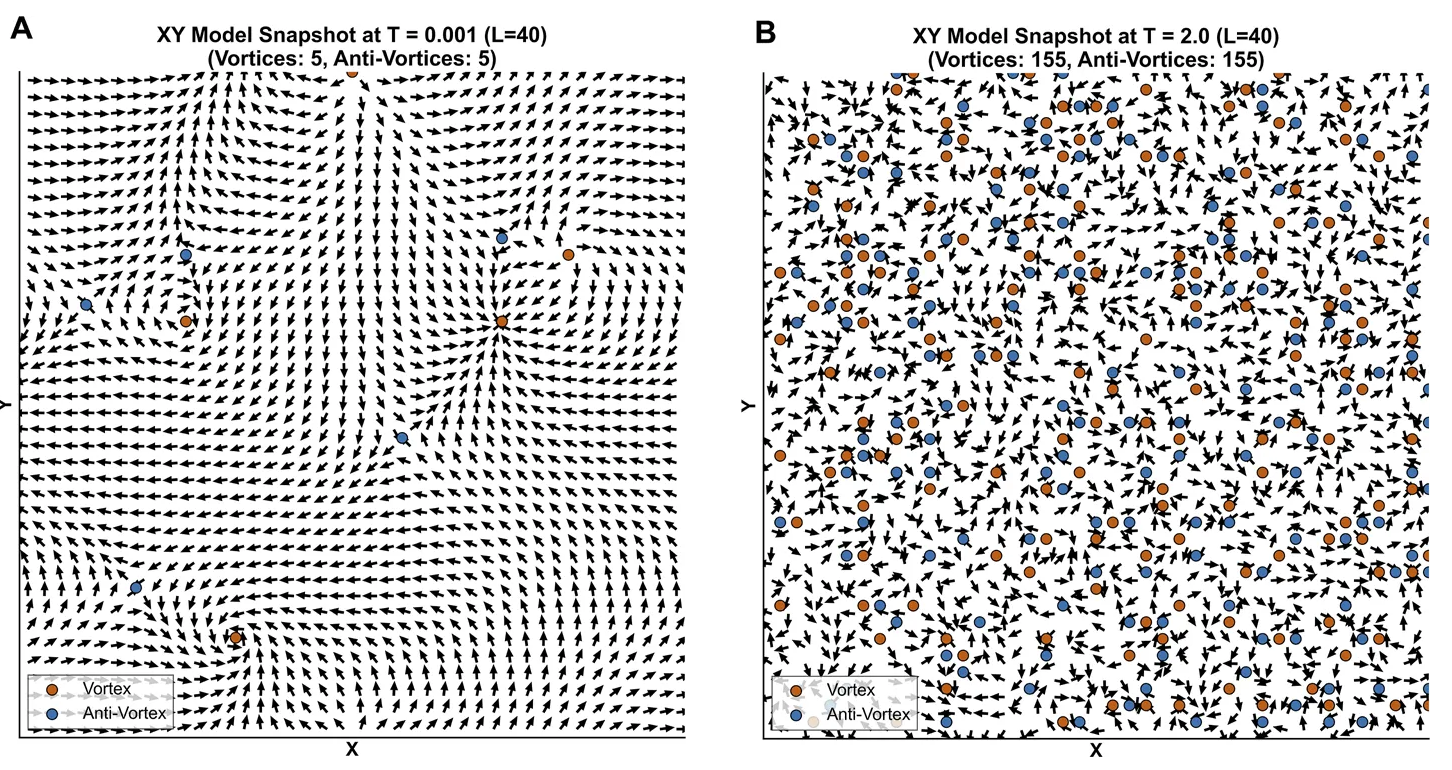 An example of topological vortices in an ordered (A) and disordered (B) state.
[1] Anand Narayan Ganesan, Pawel Kuklik, and Stanley Nattel. “A topological hypothesis for atrial fibrilllation, atrial flutter and focal atrial tachycardia: comparison and contrast with Kosterlitz-Thouless physics”. In: Frontiers in Network Physiology 5 (Jan. 2026). issn: 2674-0109. doi: 10.3389/fnetp.2025.1710567.
[2] J M Kosterlitz and D J Thouless. “Ordering, metastability and phase transitions in two-dimensional systems”. In: Journal of Physics C: Solid State Physics 6.7 (Apr. 1973), pp. 1181–1203. issn: 0022-3719. doi: 10.1088/0022-3719/6/7/010.
[3] Andres M. Belaza et al. “Social stability and extended social balance—Quantifying the role of inactive links in social networks”. In: Physica A: Statistical Mechanics and its Applications 518 (Mar. 2019), pp. 270–284. issn: 0378-4371. doi: 10.1016/j.physa.2018.11.055.
[4] Mattias Duytschaever et al. “Atrial Topology for a Unified Understanding of Typical and Atypical Flutter”. In: Circulation: Arrhythmia and Electrophysiology 17.11 (Nov. 2024). issn: 1941-3084. doi: 10.1161/circep.124.013102.
Testing Extended Phase Mapping on exotic activation patterns
Summary · Cardiac arrhythmias are described as abnormal electrical activity in the heart that disturbs the natural rhythm. This disturbance is caused by mechanisms that maintain residual electrical activity in the tissue. The most important mechanism is called reentry, where electrical waves rotate around an obstacle or around their own centre within the cardiac tissue. Current methods have already been developed to identify these locations. However, false-positive detections are a still a common occurrence with these conventional methods. Now, we would like to test whether or not our novel method (Extended Phase Mapping) can do better and detect less false-positives.
Goal · Using our software (OpenDGM), you will apply Extended Phase Mapping and Phase mapping to edge cases such as those described in Podziemski et al. [1], in order to determine whether false-positive detections are still present when using this new method compared to conventional Phase Mapping [1].
The scope of this thesis includes:
- Understanding of the methods used for simulations and rotation detection
- Creating simulations that describe the edge cases
- Setting up pipelines to analyse the results
- Identifying potential solutions to false-positive detections
This thesis is very programming-heavy. Therefore, we require the student to enjoy programming (Python).
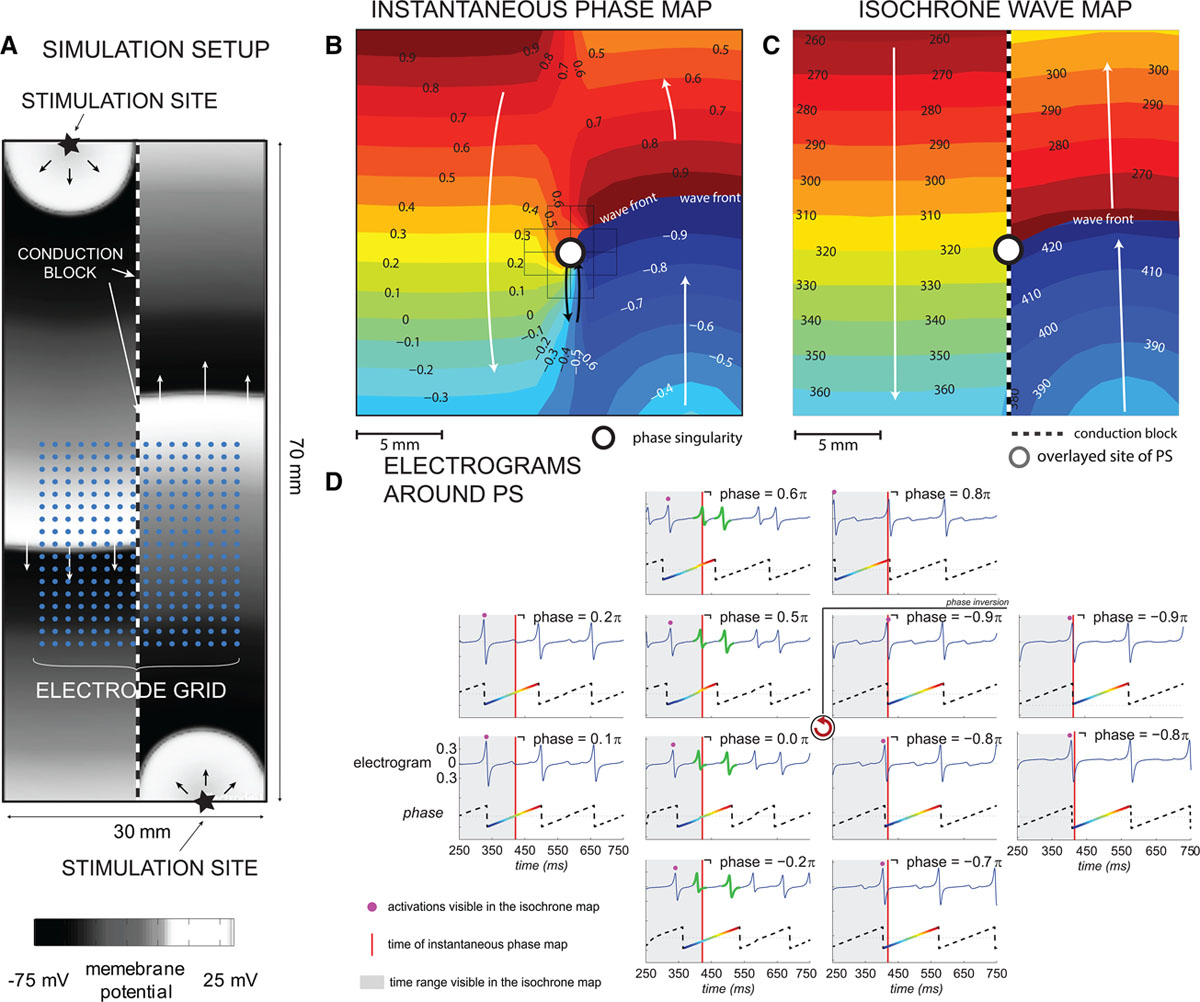 (A) Experimental setup of the comparison of a rotor to 2 planar waves. In (B) one observes Phasemapping, detecting a rotational center through a phase singularity. In (C) Naive implementations of Phase mapping find a rotational center, while no rotations is present, as the left and right side of the tissue is separated by a line of block.
[1] P. Podziemski, S. Zeemering, P. Kuklik, A. van Hunnik, B. Maesen, J. Maessen, H. J. Crijns, S. Verheule, and U. Schotten, “Rotors detected by phase analysis of filtered, epicardial atrial fibrillation electrograms colocalize with regions of conduction block,” Circulation: Arrhythmia and Electrophysiology, vol. 11, no. 10, p. e005858, 2018. doi: 10.1161/CIRCEP.117.005858